

MELI 4Q24: Strong Results, While Leverage Remains Stable Amid Higher Debt
Operating metrics exceeded expectations, while credit-fueled growth increased debt. Leverage remained unchanged.


Executive Summary
We maintain our Outperform recommendation on MercadoLibre, with a preference for MELI 2.375% 2026 bonds. We remain optimistic about MELI’s financial and business risk profile. If the company achieves investment-grade status in the short term, we believe its fundamental strengths are already reflected in current spreads. However, we estimate approximately 10 basis points of incremental upside from a technical bid.
Within MELI’s capital structure, we prefer the 2026 bonds because they trade wide relative to the EM BBB and LatAm BBB indices, offering a more favorable risk-return profile than the MELI 3.125% 2031 notes, which are currently trading tight against the same benchmarks.
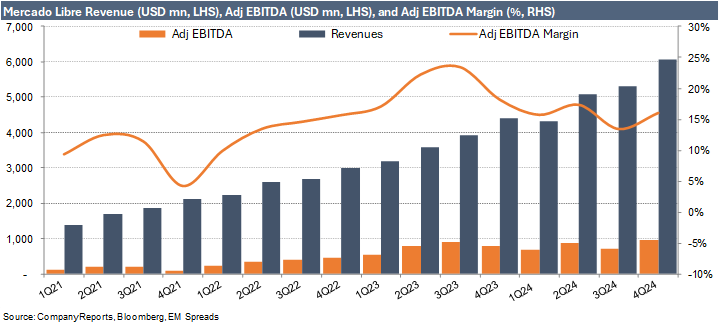
MELI delivered strong 4Q24 results. Revenues were up 37.4% YoY, driven by robust growth across key metrics including an 8.2% increase in GMV (56% FX-neutral) and a 32.5% rise in TPV (49% FX-neutral). Items sold increased by 27.1% and unique active buyers surged 23.7%, with fulfillment penetration reaching 95.1%. This performance supported Commerce and Fintech revenue growth of 44.4% and 28.6% YoY, respectively, with notable regional contributions from Brazil (+32% FX-neutral GMV), Mexico (+28% FX-neutral GMV), and Argentina (+18% in items sold). The quarter also saw sequential improvements in NIMAL and NPLs and a solid credit portfolio performance, culminating in an adjusted EBITDA of $972 million, a 21.2% YoY increase that exceeded market expectations by 23.9%.
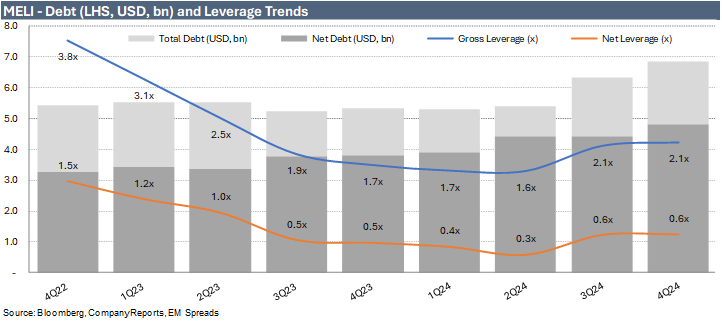
From a credit perspective. The results were marked by a 5.5% sequential improvement in LTM EBITDA and positive cash generation, with adjusted free cash flow of $680 million, although there was a $393 million sequential increase in net debt outstanding to $4.1 billion. As a result, gross leverage and net leverage remained stable at 2.1x and 0.6x, respectively.
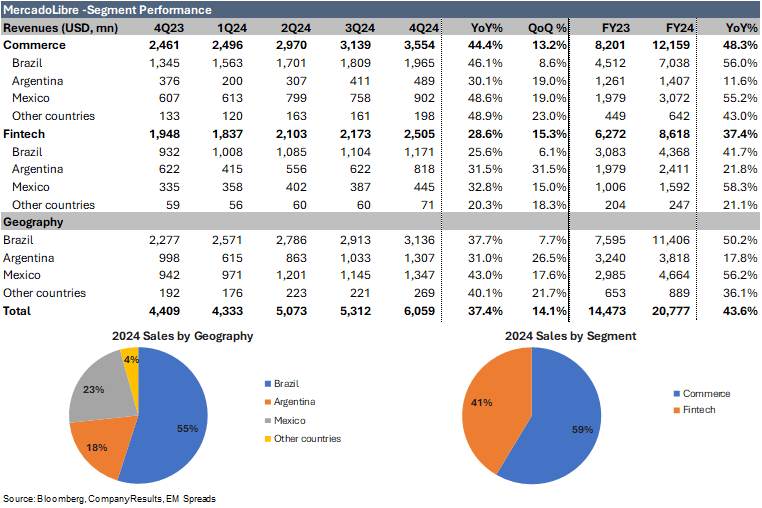
Commerce segment. In 4Q24, Commerce revenue climbed 44.4% YoY to $3.6 billion, driven by a 12.7% increase in GMV to $14.5 billion and a 27.2% rise in items sold to 526 million, along with a 23.7% YoY boost in unique buyers to 67.3 million. Regionally, Brazil led with revenues up 46.1% YoY to $2.0 billion, while Mexico’s Commerce segment reached $902 million with a 48.6% YoY gain, bolstered by a strong 1P offering. Argentina also posted solid growth, with Commerce revenue at $489 million, up 30.1% YoY, and items sold increasing by 18%. The quarter also saw advertising business penetration rise to 2.1% of GMV, driving a 41% YoY increase in ad revenue, while the Commerce take rate expanded to 24.4%, reflecting significant annual improvements.
Fintech segment. In 4Q24, Fintech revenues reached $2.5 billion, up 28.6% YoY, driven by Mexico, Argentina, and Brazil growing by 32.8%, 31.5%, and 25.6% YoY respectively and TPV climbing 32.5% YoY to $58.9 billion. Mercado Pago’s monthly active users increased to 61.2 million, buoyed by attractive deposit yields and robust credit offerings including credit cards that remain central to MELI’s value proposition. Mercado Credito’s portfolio surged to $6.4 billion with originations up 73.9% YoY and a rapidly expanding credit card segment, with NIMAL improving sequentially to 27.6%. Additionally, Mercado Fondo’s AUM jumped to $10.6 billion, supported by its remunerated account strategy and improved NPL ratios, while Fintech’s take rate declined modestly to 4.25% due to lower financial income and a strategic upmarket shift in Brazil.
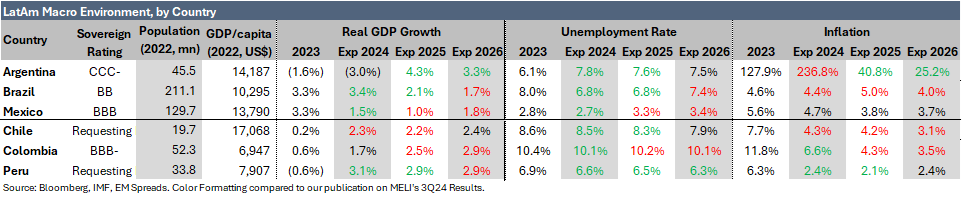
On the macroeconomic front. Aside from an anticipated rebound in Argentina with GDP per capita projected to rise by 4.3% in 2025 and 3.3% in 2026, growth in Brazil and Mexico is expected to be modest in 2025 at 2.1% and 1.0% respectively and to remain under 2.0% in 2026. Unemployment is expected to remain manageable, inflation is projected to stay under 4% in Mexico and under 5% in Brazil, while Argentina is forecast to see significant improvement in inflation rates, although still at 41% in 2025 and 25% in 2026.
MELI ended the quarter with $6.9 billion in total debt, up $526 million sequentially. Net debt reached $2.0 billion at the end of the quarter, marking a $133 million QoQ increase. Gross and net leverage remained stable sequentially at 2.1x and 0.6x, while adjusted interest coverage improved by 0.4x to 7.1x as of December 2024. Adjusted free cash flow was healthy at $680 million, and liquidity was adequate, covering short-term debt by 1.3x.
Trade Recommendation
MELI reported very solid 4Q24 results, with revenues increasing by 37.4% YoY, supported by GMV increasing 8.2% (FX-neutral: 56%), and TPV improving 32.5% (FX-neutral: 49%) compared to 4Q23. The top line improvement was also supported by a 27.1% increase in items sold and a 23.7% improvement in unique active buyers, with fulfillment penetration up 70 bps to 95.1%. These factors supported Commerce and Fintech revenues to grow to 44.4% YoY and 28.6% YoY, respectively. Geographically, this performance was driven by growth across the region, but we highlight the FX-neutral GMV improvement in Brazil of 32% YoY, and in Mexico of 28%, while Argentina saw acceleration with items sold increase by 18%. Additionally, we note that NIMAL and NPLs improved sequentially, while the credit portfolio had a solid quarter. The strength of the quarterly result is better reflected on the adjusted EBITDA generated of $972 in the quarter, representing a 21.2% YoY improvement, exceeding market expectations by 23.9%.
From a credit perspective, the results were marked by a 5.5% sequential improvement in LTM EBITDA and positive cash generation with adjusted free cash flow of $680 million, though a$393 million sequential increase in net debt outstanding to $4.1 billion. As a result, net leverage remained stable at 0.6x.
During the quarter, Fitch upgraded MELI’s credit rating to investment grade at BBB-, with a stable outlook. The company remains rated one notch below investment grade by both S&P Ratings and Moody’s, with S&P revising MELI’s outlook to positive in June. If either agency upgrades MELI’s credit rating to investment grade, we would expect a technical bid driven by its inclusion in investment-grade indices.
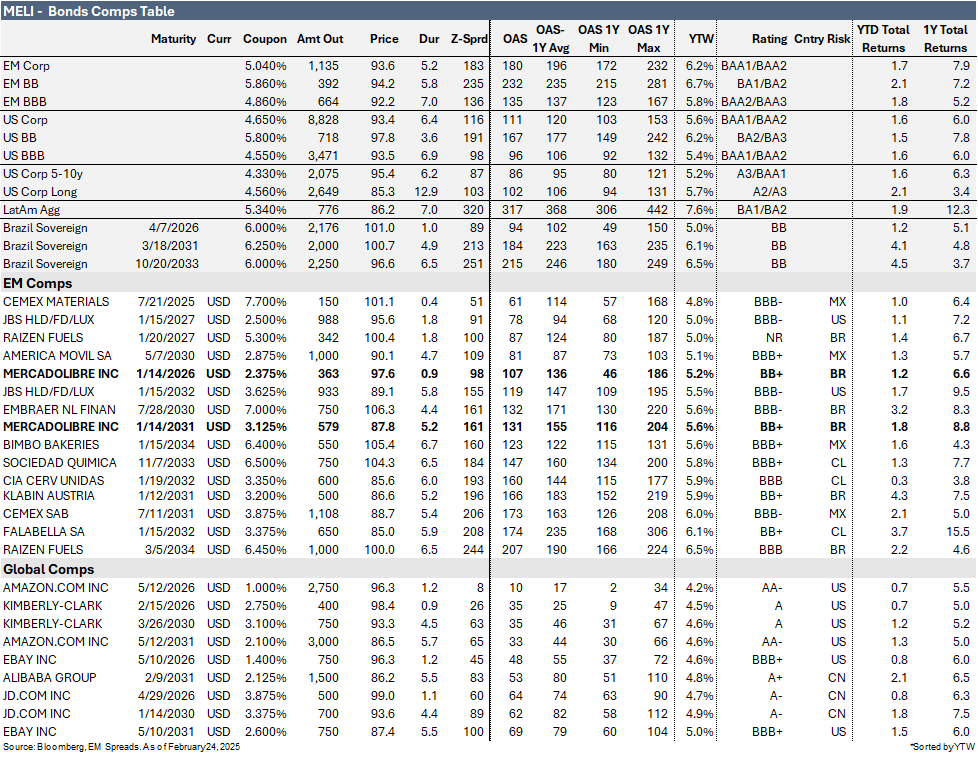
Currently, with MELI (Ba1/BB+/BBB-) 3.125% 2031 notes trading at 131 bps, the spread difference between the notes and the EM BBB Index is 1 bps, which is 9 bps tighter than the 10 bps 1-year average spread difference and 32 bps below the 2-year average spread difference of 33 bps. Though still above the recent 2-year low of -26 bps on September 27, 2024. Year-to-date, the spread difference between 2031 notes and the EM BBB Index has ranged from -21 bps to 11 bps, placing current spreads significantly closer to the higher end of this range. In our view, this indicates that the potential technical upside is largely priced into current spreads. Consequently, we expect around 10 bps of incremental upside from the technical bid at these levels if the company achieves investment-grade status. We believe most of the company’s fundamental strengths are already reflected in the pricing.
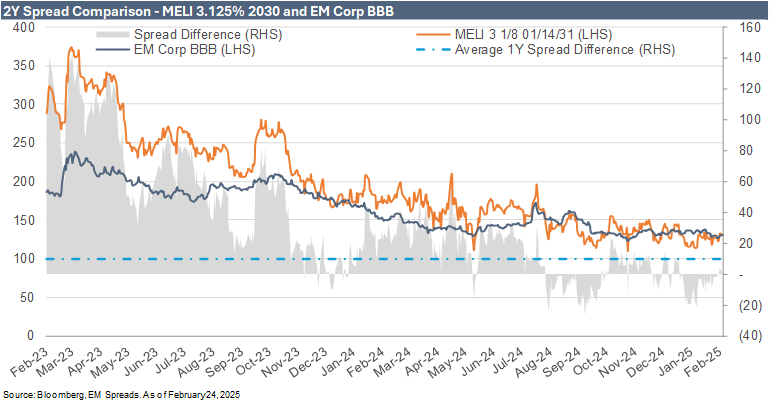
MELI bonds have significantly tightened over the last 2 years. The 2.375% 2026 notes contracted by 154 bps to 107 bps, and the 3.125% 2031notes tightened 183 bps to 133 bps. Currently, spreads for the 2026s and the 2031s are trading 35 bps and 58 bps, respectively, below their one-year OAS average and 61 bps and 104 bps tighter than their two-year average. In comparison, over the last years, the broader Emerging Markets Index contracted by 61 bps to 180 bps, the US Index tightened by 71 bps to 111 bps, and the Latin America Aggregate Index declined by 37 bps to 317 bps. MELI’s spread tightening is particularly notable given that some comparable Brazilian sovereign bonds saw spreads widen during the same period. Brazilian sovereign bonds maturing in 2028 are trading at 123 bps, 47 bps wider than a year ago, and 3 bps tighter than their one-year average. Bonds maturing in 2031 are trading at 182 bps, 20 bps above a year ago and 38 bps tighter with their one-year average.
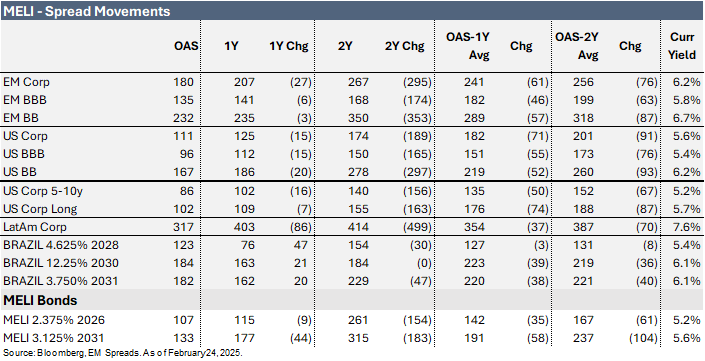
At current spread levels, we prefer MELI (Ba1/BB+/BBB) 2.375% 2026 bonds, yielding 5.2% for a 0.9-year duration, over MELI 3.125% 2031 bonds, yielding 5.6% for a 5.2-year duration. The broader EM Index yields 6.2%for a 5.2-year duration, and the EM BBB Index yields 5.8% for a 7.0-year duration. We find the 2026 bonds more attractive than the 2031 bonds, as the former trade wider than the Latin American BBB, EM BBB curves, and the Brazilian sovereign curve, while the 2031 notes trade tighter than these benchmarks. This preference is further supported when compared to BBB- rated peers, such as JBSSBZ (Baa3/BBB-/BBB-) 2027 notes yielding 5.0% for a 1.8-year duration, and CEMEX (BBB-/BBB-) 2025 notes yielding 4.8% for a 0.4-year duration.
In assessing the current risk/return profile of the 2031 notes, we find that the existing prices do not sufficiently account for MELI’s inherent risks, such as operating in Latin America with significant exposures to high-risk countries like Argentina and Brazil. Additionally, the current spread levels do not adequately compensate for the combined risks of generating all revenues in domestic Latin American currencies, exposure to regulatory challenges, and a potentially more competitive landscape. However, the notes could benefit from a technical bid if MELI achieves investment-grade status.
4Q24 Operating Performance
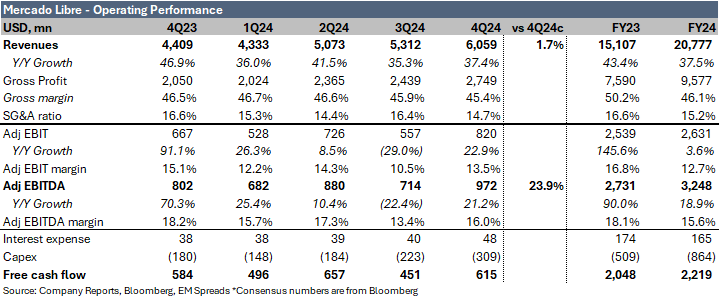
MercadoLibre (Ba1/BB+/BBB-) reported a 37.4% YoY increase in 4Q24 revenues (FX-neutral: 79%), rising to $6.1 billion from $4.4 billion in 4Q23. Healthy growth across key markets pushed revenues 1.7% above market expectations. In Brazil, revenues increased 37.7% YoY to $3.1 billion in 4Q24. In Mexico, revenues grew 43.0% YoY to $1.3 billion, while in Argentina, revenues reached $1.3 billion in 4Q24, reflecting a 31.0% YoY improvement. By segment, both Commerce and Fintech experienced significant growth of 44.4% YoY and 28.6% YoY, respectively. The Commerce segment's growth was driven by an 8.2% YoY increase in gross merchandise volume (GMV), while Fintech’s total payment volume (TPV) rose by 32.5% YoY.
In 4Q24, gross profit reached $2.7 billion, a 34.1% increase from $2.1 billion in 4Q23. The gross margin contracted by 113 bps, dropping to 45.4% from 46.5%. The cost of goods sold rose faster than revenue, increasing 40.3% YoY to $3.3 billion.
MELI’s 3Q24 EBIT was $820 million, up significantly by 47.2% QoQ and 22.9% YoY from $557 million in 3Q24 and $667 million in 4Q23. The EBIT margin expanded by 305 bps sequentially but declined 159 bps YoY to 13.5% in the quarter. The margin expansion was primarily driven by strong cost management across the company’s logistics network, efficiencies in collection fees, and operating leverage in sales & marketing and product development. These were partially offset by a headwind from provisions for doubtful accounts that increased 76.3% YoY to $527 million in the quarter, representing a 280 bps impact on EBIT margins. 3Q24 adjusted EBITDA increased significantly by 36.1% QoQ and 21.2% YoY to $972 million, exceeding market expectations by 23.9%. The adjusted EBITDA margin expanded 260 bps sequentially but decreased by 215 bps YoY to 16.0%.
Macro Trends
Despite MELI’s presence in 18 countries, the company generated 95.7% of its 2024 revenues in Brazil, Argentina, and Mexico. From 2017 to 2023, Brazil contributed an average of 56.9% of total revenues, Argentina 23.5%, and Mexico 14.5%. Consequently, these economies are key drivers of MELI’s operating performance. Given the economic volatility and history of political uncertainty in Brazil and Argentina, we closely monitor their macroeconomic outlook.
On the macroeconomic front, aside from an anticipated rebound in Argentina with GDP per capita projected to rise by 4.3% in 2025 and 3.3% in 2026, growth in Brazil and Mexico is expected to be modest in 2025 at 2.1% and 1.0% respectively and remain under 2.0% in 2026. Unemployment is expected to remain manageable, inflation is projected to stay under 4% in Mexico and under 5% in Brazil, while Argentina is forecast to see significant improvement in inflation rates, although still at 41% in 2025 and 25% in 2026.
4Q24 Segment Results
Commerce
Commerce revenue, accounting for 59% of 2024 total revenues, increased by 44.4% YoY to $3.6 billion in 4Q24. This growth was driven by higher GMV, which rose 12.7% YoY to $14.5 billion in the quarter. Items sold reached 526 million, a 27.2% increase YoY. Management noted that Commerce has experienced significant growth by consistently investing in all aspects of the company’s user experience, leading to a 10.7% QoQ and 23.7% YoY rise in unique buyers, reaching 67.3 million in 4Q24.
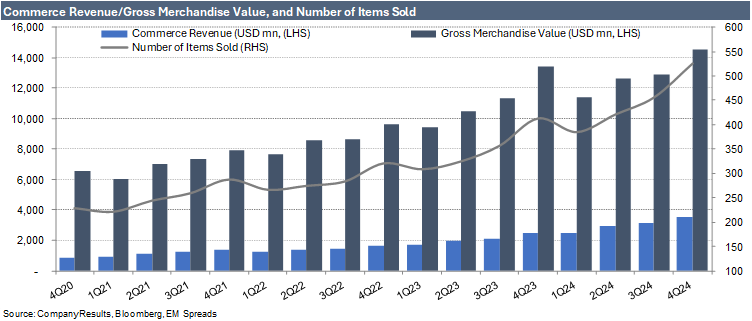
Geographically, Commerce revenues were primarily driven by Brazil, which saw top line increases of 8.6% QoQ and 46.1% YoY to $2.0 billion. Mexico generated $902 million in Commerce revenues in 4Q24, representing a 19.0% sequential increase and a 48.6% YoY improvement. Management noted that its 1P offering played an important role in the positive results as it accounted for eight of the top ten selling items during Black Friday in Brazil and all of the top ten sellers during El Buen Fin in Mexico. Most of MELI’s GMV growth was driven by sellers’ assortment. Brazil continues to stand out with FX-neutral GMV growing 32% YoY and items sold increasing 30% YoY in 4Q24, while in Mexico, GMV and items sold improved 28% YoY and 29% YoY in 4Q24.
Commerce revenues in Argentina reached $489 million, reflecting increases of 19.0% QoQ and 30.1% YoY. Trends in Argentina were encouraging, with items sold growing 18% YoY despite facing pull-forward demand in 4Q23. Management is optimistic about the growth opportunities ahead in Argentina given the improving macro trends.
MELI has been expanding its logistics network to enhance the user experience for buyers by enabling faster shipping times and reducing late deliveries. In 4Q24, the company delivered 147.5 million packages on the same or next day, a 9.6% QoQ and 21.3% YoY increase. However, more buyers are choosing slower shipping methods, which enable free shipping on a wider assortment of products, while improved service outside the main urban centers is encouraging new demand. Consequently, deliveries made on the same day or next day declined 2.0 pp sequentially and 3.0 pp YoY to 49% in 4Q24.
The advertising business penetration increased to 2.1% of GMV in the quarter, up from 2.0% in 3Q24 and 1.6% in 4Q23, supporting ad revenue growth of 41% YoY. The Commerce take rate expanded by 0.1 pp sequentially and 6.1 pp YoY to 24.4%, compared to 24.3% in 3Q24 and 18.3% in 4Q23.
Fintech
Fintech revenues, representing 41% of 2024 total revenues, reached $2.5 billion in 4Q24, up 15.3% QoQ and 28.6% YoY from $2.2 billion in 3Q24 and $1.9 billion in 4Q23. The improvement was supported by strong trends across all three main countries, with Mexico increasing 32.8% YoY, Argentina improving 31.5% YoY, and Brazil rising 25.6% YoY. TPV increased by 16.2% QoQ and 32.5% YoY to $58.9 billion, with acquiring TPV up 16.1% sequentially and 20.4% YoY.
Mercado Pago reached 61.2 million monthly active users in 4Q24, up from 56.2 million in 3Q24 and 45.8 million in 4Q23. The user base growth was supported by MELI’s positive value proposition offering attractive yields on deposits and access to credit lines, including credit cards in Brazil and Mexico. Management noted that Mercado Pago credit cards are core to their value proposition.
Mercado Credito’s portfolio experienced another quarter of strong growth, reaching $6.4 billion in 4Q24, up from $6.0 billion in 3Q24 and $3.8 billion in 4Q23, with originations rising 15.8% QoQ and 73.9% YoY to $7.5 billion in the quarter. The credit card segment remains a key growth driver, with the credit card portfolio expanding by 12.6% QoQ and 118.3% YoY to $2.6 billion in 4Q24. MELI remains committed to its underwriting models, which give management confidence to scale the credit card segment at this accelerated pace. However, the net interest margin after losses (NIMAL), calculated as credit revenues minus provisions for doubtful accounts and funding costs, increased sequentially to 27.6% in 4Q24 from 24.2% in 3Q24 but declined compared to 39.8% in 4Q23. The sequential improvement was driven by strong collections, partly due to favorable seasonality and better risk model performance, while the YoY deterioration was mostly due to an increased share of lower-NIMAL credit cards in the portfolio. Credit cards accounted for 41.0% of the Mercado Credito portfolio in 4Q24, up from 39.0% in 3Q24 and 32.0% in 4Q23.
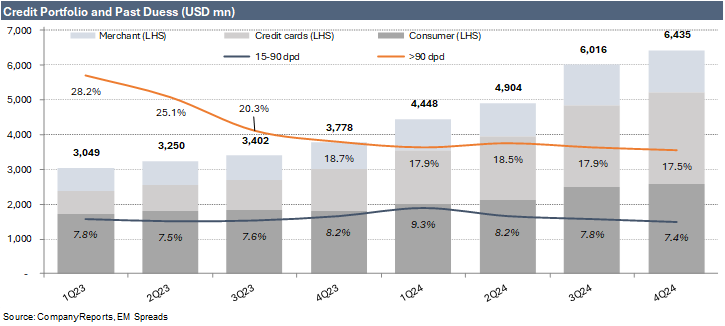
Mercado Fondo's total assets under management (AUM) grew significantly to $10.6 billion in 4Q24, up from $8.0 billion in 3Q24 and $4.6 billion in 4Q23. Mercado Fondo’s value proposition centers on its remunerated account, which offers immediate interest on deposits with instant liquidity—a particularly valuable feature in high-inflation countries where money in an account would otherwise quickly lose value. Management noted that this strategy is fundamental to the company’s value proposition, serving as an entry point for broader engagement with Mercado Pago. MELI’s 15–90 day non-performing loans (NPL) decreased sequentially from 7.8% in 3Q24 to 7.4% in 4Q24 and declined YoY from 8.2% in 4Q23. NPLs over 90 days improved to 17.5% in 4Q24 from 17.9% in 3Q24 and 18.7% in 4Q23, primarily due to a shift toward lower-risk cohorts in the consumer and merchant portfolios. The largest component of the credit portfolio is credit cards, totaling $2.63 billion in 4Q24 (41% of the credit portfolio), followed by consumer credit at $2.59 billion (40.3%) and merchant credit at $1.21 billion (18.7%). Management emphasized that risk management remains the top priority for MELI’s credit business.
Fintech’s take rate declined modestly to 4.25% in 4Q24 from 4.29% in 3Q24 and 4.38% in 4Q23, primarily due to lower financial income across all countries and a shift upmarket in Brazil, partially offset by higher credit revenue.
Financial Profile
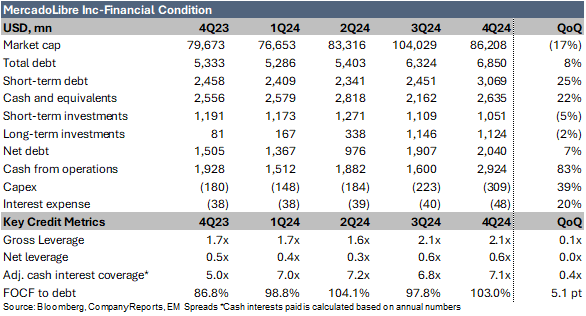
MELI ended 4Q24 with $6.9 billion in total reported debt, up $526 million sequentially from $6.3 billion as of September 2024 (December 2023: $5.3 billion). This total includes $1.1 billion in leasing obligations as of September 2024. Of the reported debt, $2.8 billion was short-term, with an additional $241 million in short-term leasing obligations. This increase in debt was primarily due to the financing of Mercado Pago’s operations.
Cash and cash equivalents stood at $2.6 billion, a $473 million sequential increase and a $79 million improvement compared to 4Q23. Short-term investments, excluding time deposits and foreign government debt securities held in guarantee, decreased by $58 million QoQ to $1.1 billion as of December 2024 (December 2023: $1.2 billion). Long-term investments, excluding those held in VIEs for securitization transactions and equity securities held at cost, declined by $22 million sequentially to $1.1 billion as of December 2024 (December 2023: $1.12 billion). Consequently, net debt reached $2.0 billion at the end of the quarter, a $133 million sequential increase from $1.9 billion as of September 2024 (December 2023: $1.5 billion).
Adjusted EBITDA of $972 million in 4Q24 comfortably covered $305 million in capex and $48 million in interest expense, resulting in free cash flow of $619 million. This represents a significant sequential improvement from a $451 million inflow in 3Q24 and a $584 million inflow in 4Q23. After accounting for $1.2 billion in working capital inflow, $124 million in taxes, and $6 million in acquisitions, MELI reported a net free cash flow of $1.7 billion in the quarter. This marks a sharp improvement from net free cash flow of $663 million in 3Q24 and $1.0 billion in 4Q23.
Operating cash flow was robust at $2.9 billion in 4Q24, up from $1.6 billion in 3Q24 and $1.9 billion in the same period last year, comfortably covering $305 million in capex and resulting in free operating cash flow of $2.6 billion.
Adjusted free cash flow, a metric MELI began disclosing in 2Q24, was a $680 million inflow, bringing the 2024 total to $1.3 billion. This was achieved after investing $305 million in capex, primarily to scale its logistics networks, and $655 million in Fintech, mainly for credit business growth. During the quarter, MELI did not allocate capital to acquisitions, share repurchases, or dividends.
MELI’s interest expense was $48 million in 4Q24, up from $38 million in the same period last year and from $40 million in 3Q24.
Our analysis monitors the total debt-to-tangible equity ratio to better assess MELI’s growing credit risk exposure. In 4Q24, tangible equity rose to $4.1 billion, up from $3.8 billion in 3Q24 (December 2023: $2.9 billion). However, the debt-to-tangible equity ratio increased modestly, reaching 1.7x as of December 2024 compared to 1.6x as of September 2024 (December 2023: 1.5x).
Key credit metrics improved primarily due to an 18.3% sequential increase in LTM adjusted EBITDA and healthy cash generation, although this was offset by higher debt outstanding.
Gross leverage remained stable QoQ at 2.1x as of December 2024 (December 2023: 1.7x)
Net leverage remained unchanged sequentially at 0.6x as of December 2024 (December 2023: 0.5x)
Adjusted cash interest coverage increased to 7.1x in 4Q24 from 6.8x in 3Q24 (4Q23: 5.0x)
FOCF to debt improved to 103% as of December 2024 from 98% as of September 2024 (December 2023: 87%)
Debt to tangible equity increased by 0.1x sequentially to1.4x as of December 2024 (December 2023: 1.5x)
Liquidity
MELI’s liquidity remains healthy. The company has $3.1 billion in short-term debt, which is covered by $4.1 billion in total liquidity. This liquidity comprises a cash position of $2.6 billion, short-term investments of $1.1 billion, and $400 million in revolver credit availability. Total liquidity improved by $415 million sequentially.
Our total liquidity calculation excludes MELI’s $2.1 billion in restricted cash as of December 2024 (compared to $1.3 billion in September 2024), a mandatory reserve under various central bank regulations. As of December 2024, MELI’s total liquidity covered short-term debt by 1.3x, down from 1.5x in September 2024 and 1.7x in December 2023.
See Also:
Vista Energy (February 19, 2025): Vista Energy: Strong Reserves Growth Continues
Suzano (February 14, 2025) Suzano 4Q24: 2031s & 2032s Offer Value as Fundamentals Strengthen
Cemex (February 7, 2025): Cemex 4Q24: A Solid EM Credit, But Tariff Overhang Limits Near-Term Potential.
Cemex & Pemex (February 5, 2025): U.S. Tariffs and Their Potential Impact on Cemex and Pemex.
Pemex (January 31, 2025): Lack of Concrete Action Weights on the Outperform Thesis.
Suzano (January 30, 2025) Initiation coverage report.
YPF (January 8, 2025): Recommendation on YPF's new USD 9NC4 unsecured notes.
Vista Energy (December 18, 2024): New issue snapshot.
YPF (December 3, 2024): Initiation coverage report.
Disclaimer
Opinions presented in this report are based on and derived primarily from public information that EM Spreads LLC ("EM Spreads," "We," or "Our") considers reliable. Still, we make no representations or warranty regarding their accuracy or completeness. EM Spreads accepts no liability arising from this report. No warranty, express or implied, as to the accuracy, timeliness, completeness, or fitness for any particular purpose of any such analysis or other opinion or information is given or made by EM Spreads in any form.
All information contained in this document is protected by Copyright law, and none of such information may be copied, repackaged, transferred, redistributed, resold, or stored for subsequent use for any such purpose, in whole or in part, by any person without EM Spreads’ prior written consent. All rights reserved. Reproduction of this report, even for internal distribution, is strictly prohibited. The content shall not be used for any unlawful or unauthorized purposes.
This content is provided on an "as is" basis and should not be regarded as a substitute for obtaining independent advice. EM Spreads disclaims all express or implied warranties, including, but not limited to, any warranties of merchantability or fitness for a particular purpose or use, freedom from bugs, software errors, or defects, that the content’s functioning will be uninterrupted or that the content will operate with any software or hardware configuration. Investors must determine the appropriateness of an investment in any instruments referred to herein based on the merits and risks involved, their own investment strategy, and their legal, fiscal, and financial position. As this document is for information purposes only and does not constitute or qualify as an investment recommendation or advice or as a direct investment recommendation or advice, neither this document nor any part of it shall form the basis of or be relied on in connection with or act as an inducement to enter, any contract or commitment whatsoever. Nothing in this report constitutes investment, legal, accounting, or tax advice or a representation that any investment or strategy is suitable or appropriate to your individual circumstances or otherwise a personal recommendation to you.
The opinion contained in this report may not be suitable for your specific situation. Investors are urged to contact their investment advisors for individual explanations and advice. EM Spreads does not offer advice on the tax consequences of investments, and investors are urged to contact an independent tax adviser for individual explanations and advice. In no event shall EM Spreads be liable to any party for any direct, indirect, incidental, exemplary, compensatory, punitive, special, or consequential damages, costs, expenses, legal fees, or losses (including, without limitation, lost income or lost profits and opportunity costs or losses caused by negligence) in connection with any use of this report.
This document may contain forward-looking statements that involve risks and uncertainties. Actual results may differ materially from those expressed or implied in such statements. EM Spreads undertakes no obligation to update any forward-looking statements to reflect events or circumstances after the date of this document or to discontinue it altogether without notice. EM Spreads reserves the right to modify the views expressed herein without notice.
The content in this report is provided to you for information purposes only. EM Spreads’ opinions and analysis are not recommendations to purchase, hold, or sell any securities or to make any investment decisions and do not address the suitability of any security. EM Spreads assumes no obligation to update the content following publication in any form or format. The content in the report shall not be relied on and is not a substitute for the skill, judgment, and experience of the user, its management, employees, advisors, and /or clients when making investment and other business decisions. EM Spreads has not taken steps to ensure that the securities referred to in this report are suitable for any investor.
This report is not directed to or intended for distribution to or use by any person or entity who is a citizen or resident of or located in any locality, state, country, or other jurisdiction where such distribution, publication, availability, or use would be contrary to law or regulation or which would subject EM Spreads to any registration or licensing requirement within such jurisdiction. No person should review or rely on this report if such review or reliance would require EM Spreads to obtain any registration or license in any such jurisdiction.
All estimates and opinions expressed in this report reflect the analysts' independent judgment as of the issue's date about the subject company or companies and its or their securities. No part of the analyst's compensation was, is, or will be directly or indirectly related to this report's specific recommendations or views. The research analysts contributing to the report may not be registered /qualified as research analysts with any regulatory or government body or market regulator.